Introduction
R Setup
Figure 1
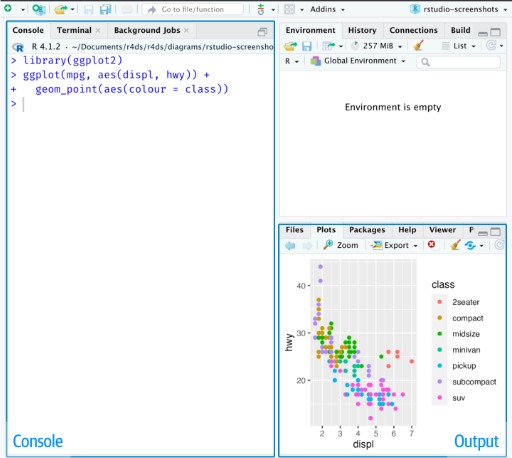
R Studio Layout with three panes: Console,
Environment and Plots
Packages in R
Vectors and variable types
Figure 1
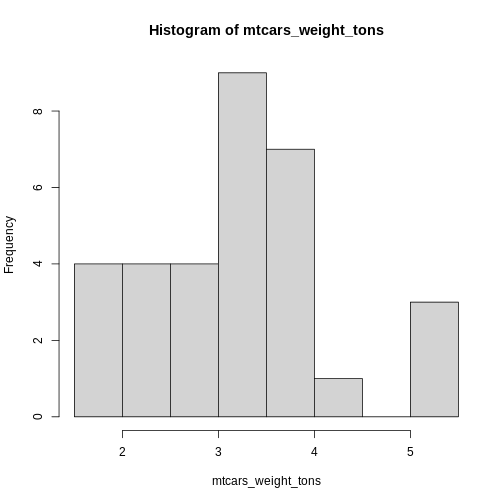
Figure 2
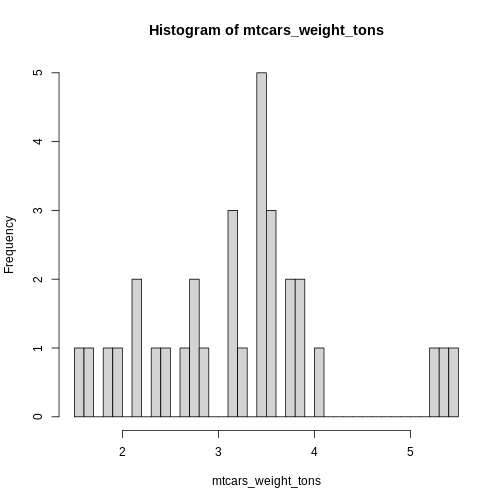
Projects
Data Visualization (1)
Figure 1

Roy Kent saying Fuck
Figure 2
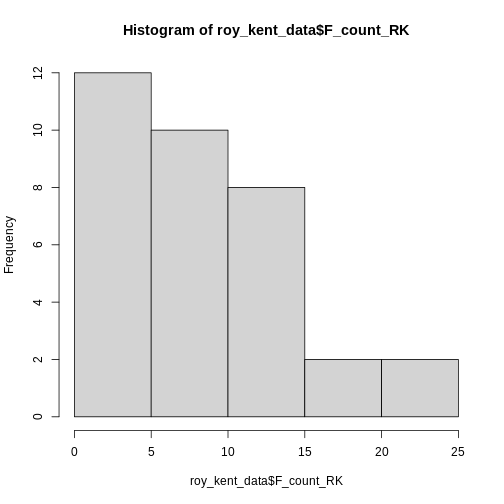
Figure 3
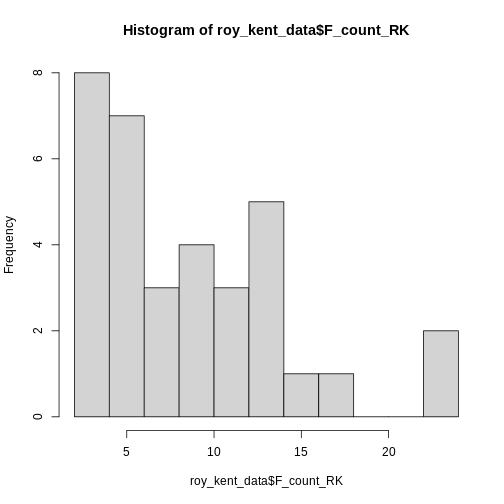 This already provides us some more useful information. Roy seems to
swear between 0 and 12 times most often and swears a lot in two
episodes.
Figure 4
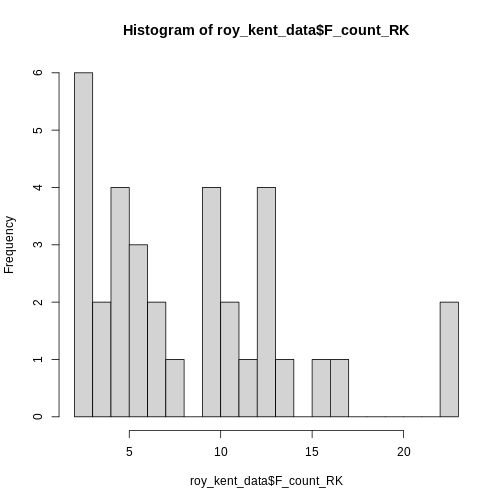
Figure 5

Figure 6
Figure 7
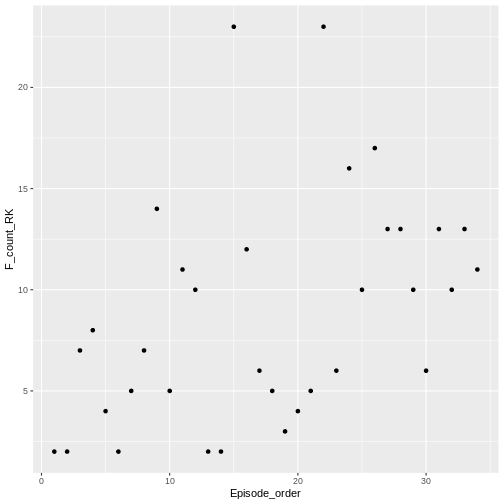
Figure 8
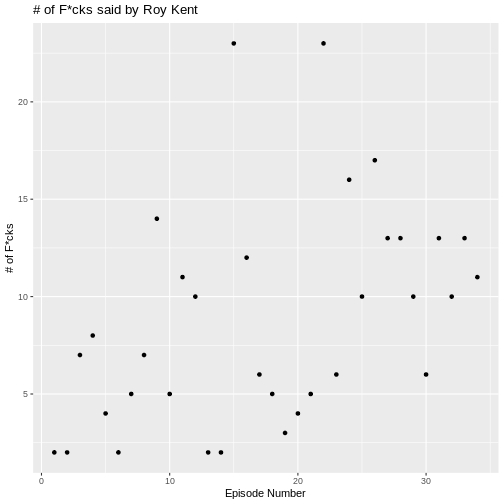
Figure 9
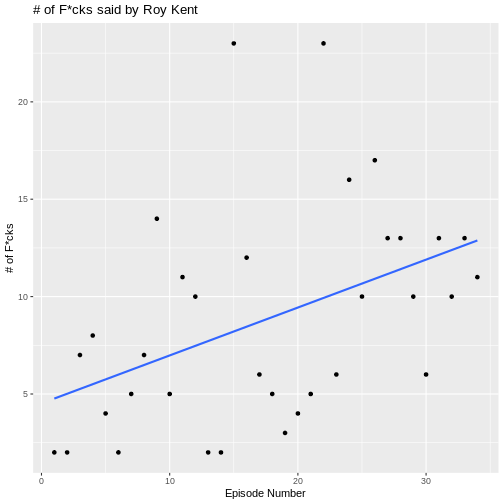
Figure 10
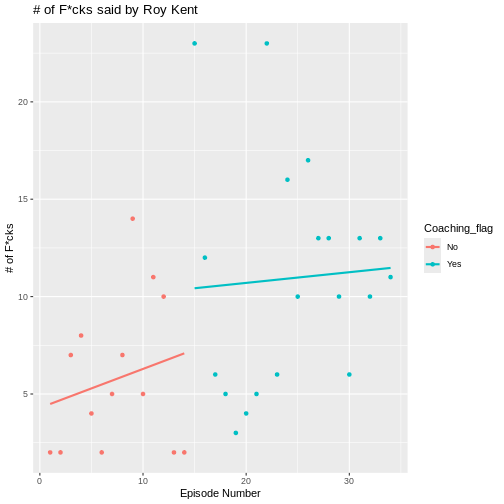
Figure 11
Figure 12
Data Visualization (2)
Figure 1
Figure 2
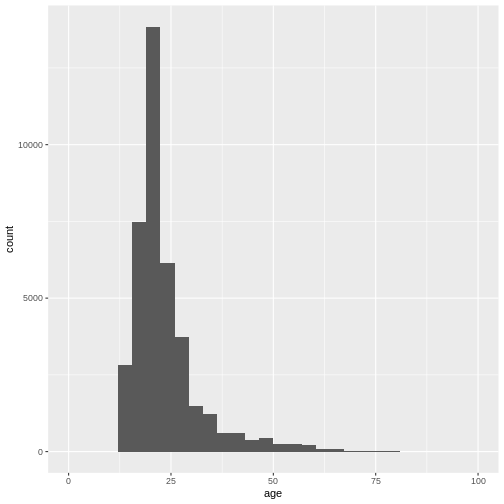
Figure 3
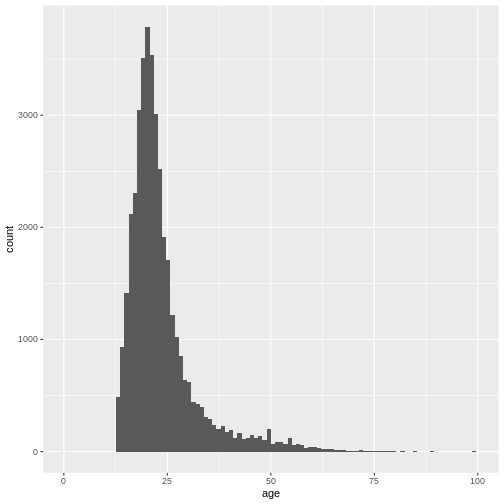 We can also adjust the size of the bins, not the number of bins by using
the
 binwidth argument.
Figure 4
Figure 5
Figure 6
Figure 7
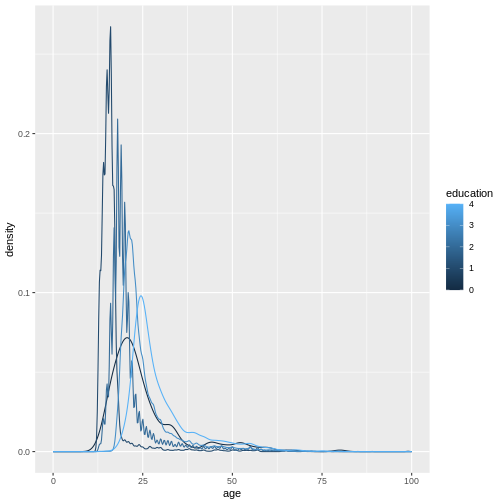
Figure 8
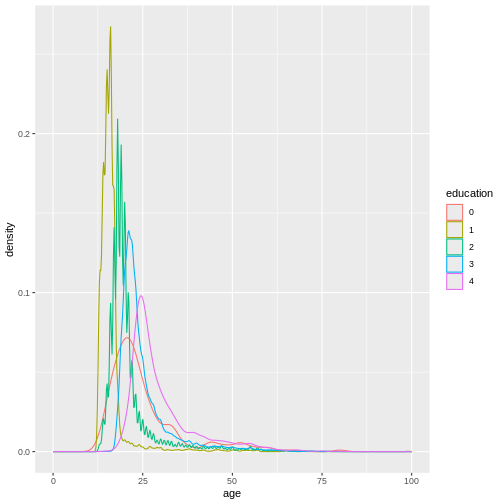
Figure 9
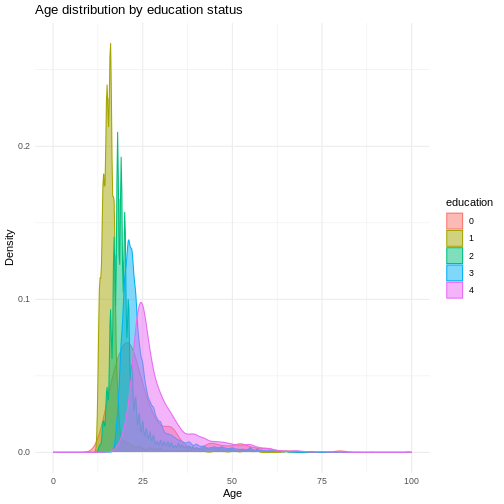
Figure 10
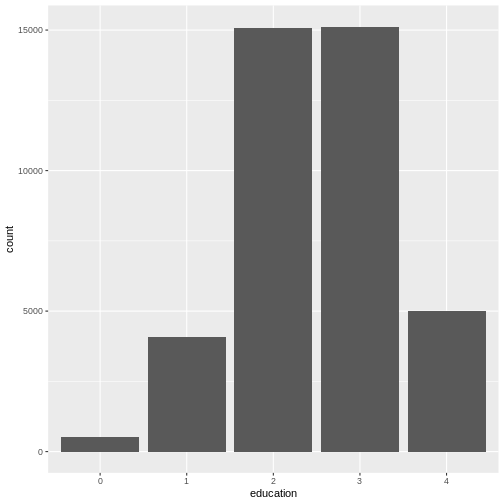
Figure 11
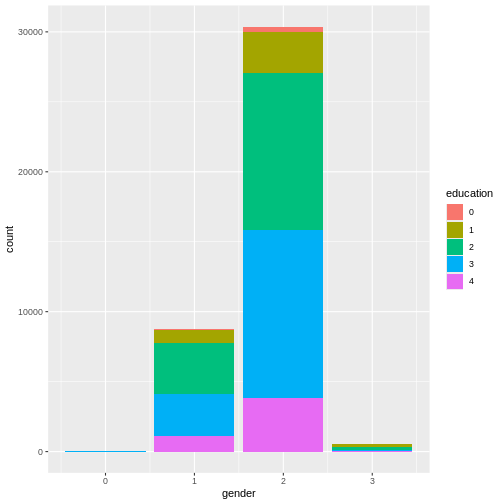
Figure 12
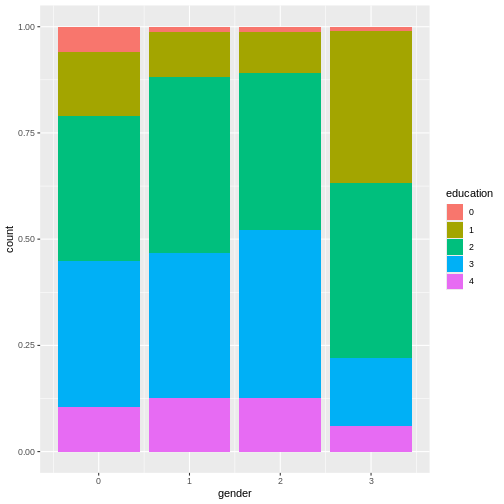
Figure 13
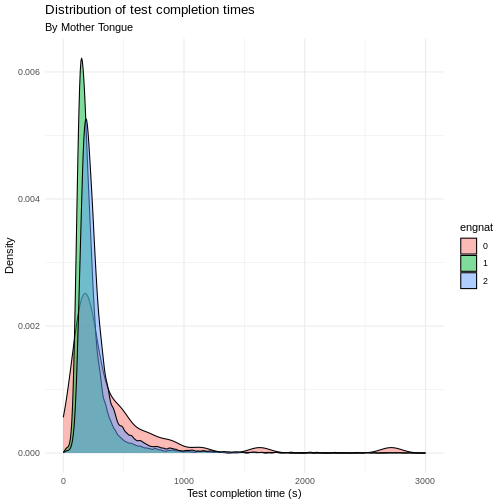
Figure 14
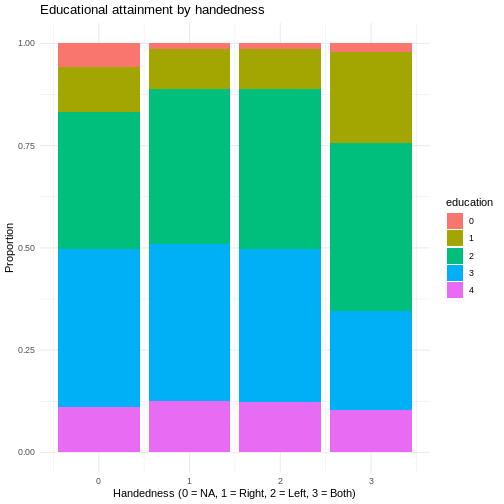
Filtering data
Figure 1
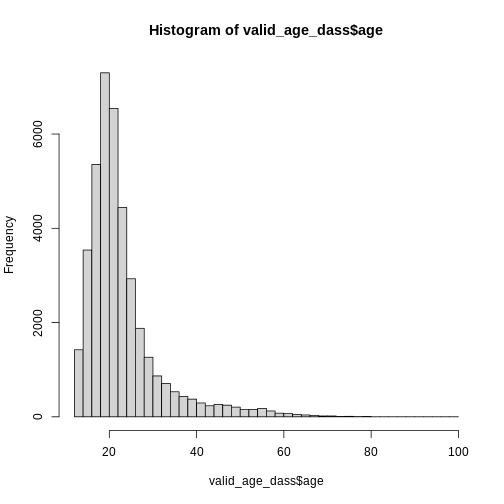
Figure 2
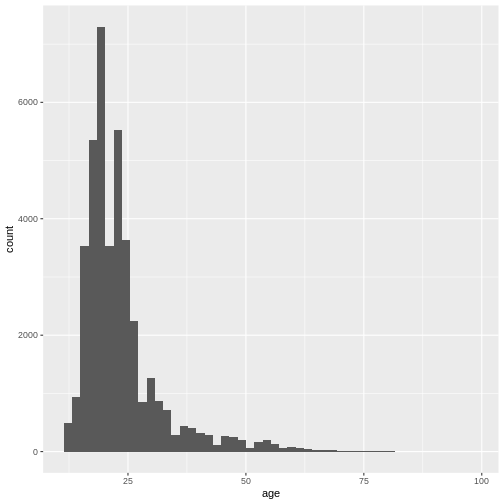
Figure 3
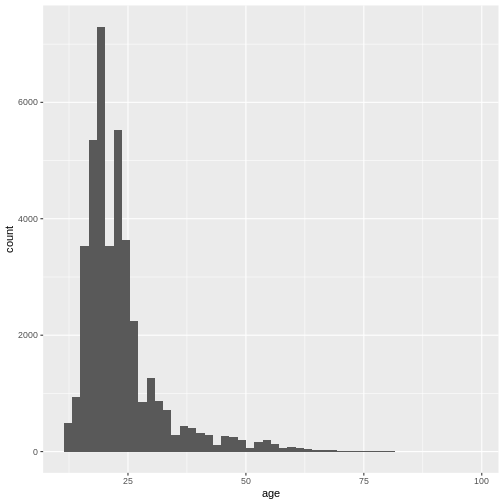
Figure 4
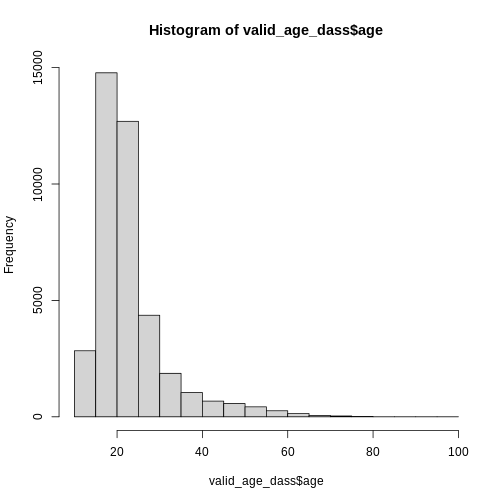
Figure 5
Figure 6
Figure 7
Figure 8
Creating new columns
Count and Summarize
Midterms
Figure 1
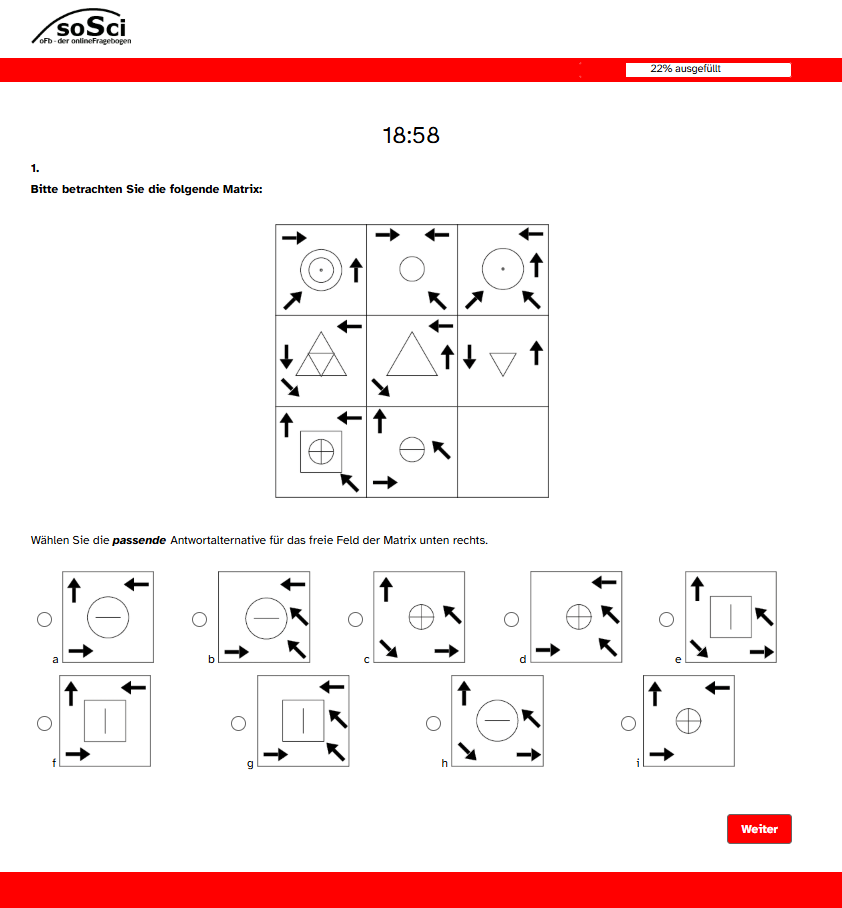
Intelligence Test (HeiQ) Item with red
background
t-Test
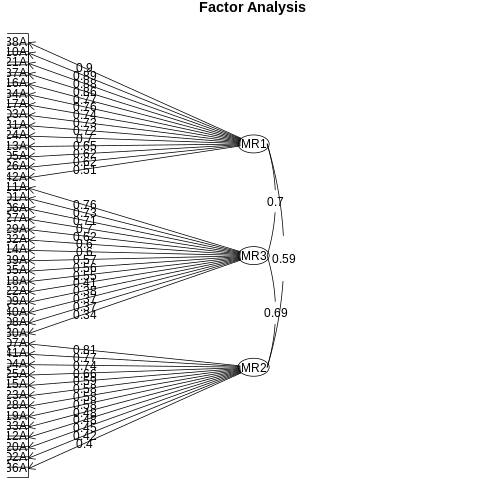
Factor Analysis - Introduction & EFA
Figure 1
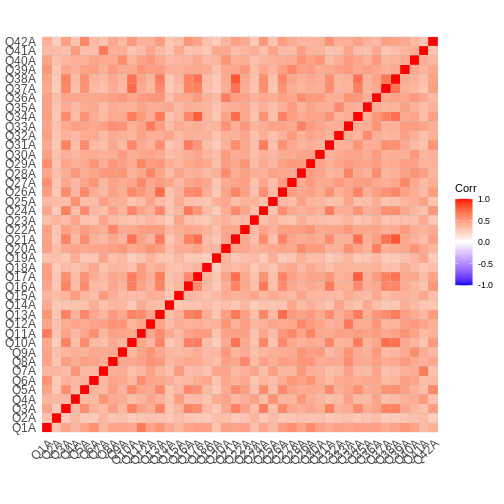
Figure 2
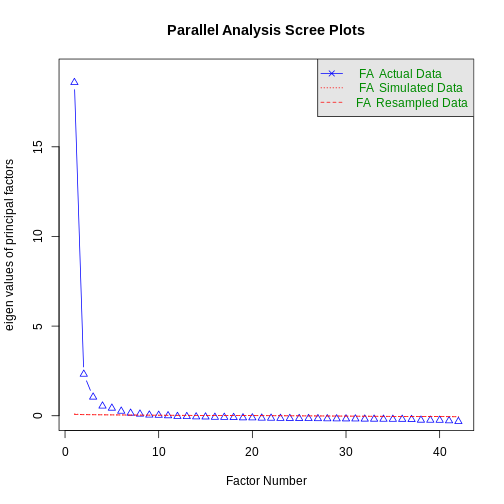
Figure 3
