Introduction
R Setup
Figure 1
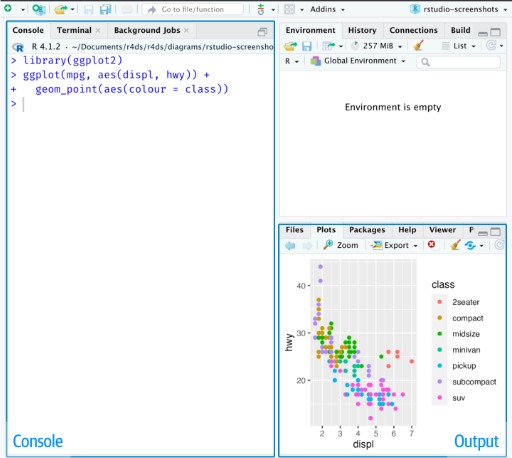
R Studio Layout with three panes: Console,
Environment and Plots
Packages in R
Vectors and variable types
Figure 1
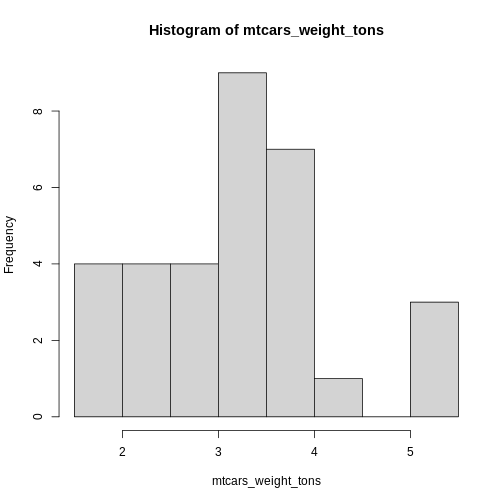
Figure 2
Projects
Data Visualization (1)
Figure 1
Roy Kent saying Fuck
Figure 2
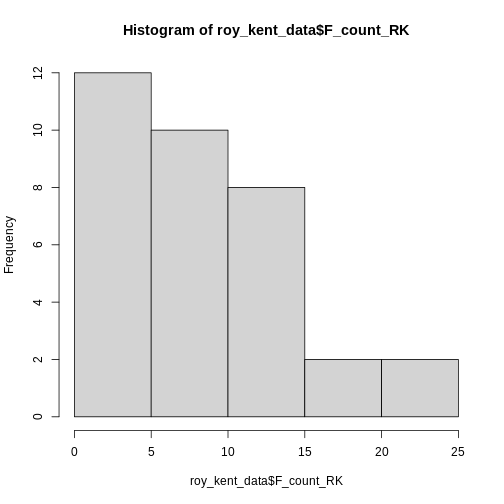
Figure 3
 This already provides us some more useful information. Roy seems to
swear between 0 and 12 times most often and swears a lot in two
episodes.
This already provides us some more useful information. Roy seems to
swear between 0 and 12 times most often and swears a lot in two
episodes.
Figure 4
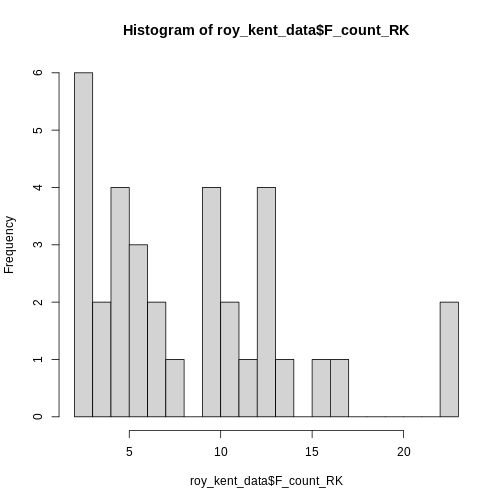
Figure 5

Figure 6
Figure 7
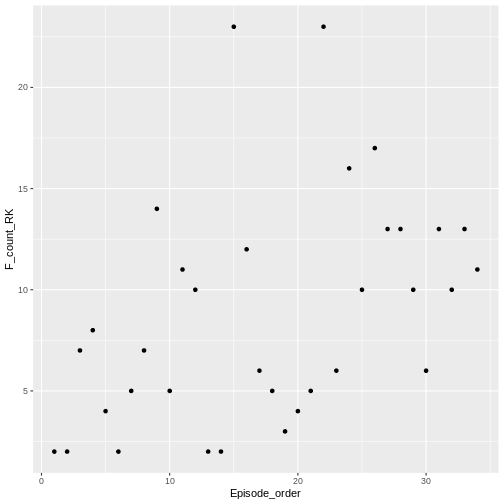
Figure 8
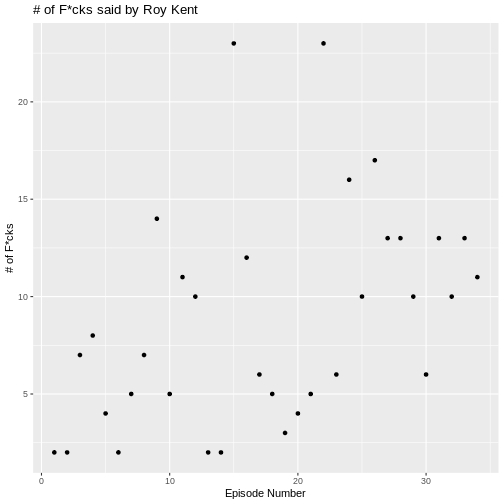
Figure 9
Figure 10
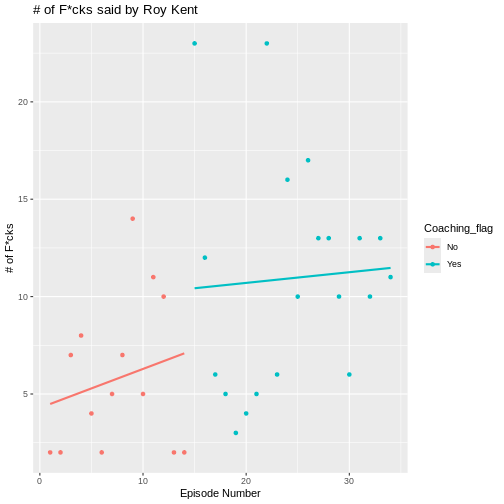
Figure 11
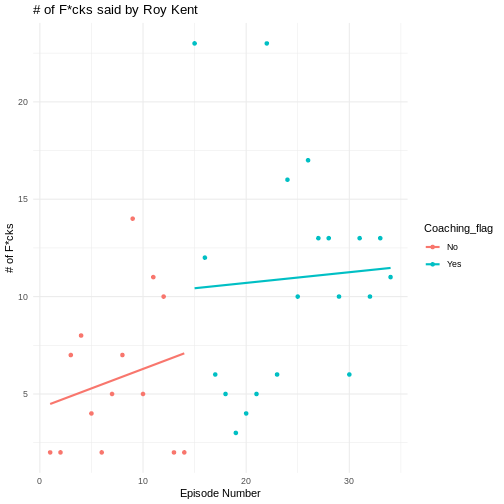
Figure 12
Data Visualization (2)
Figure 1
Figure 2
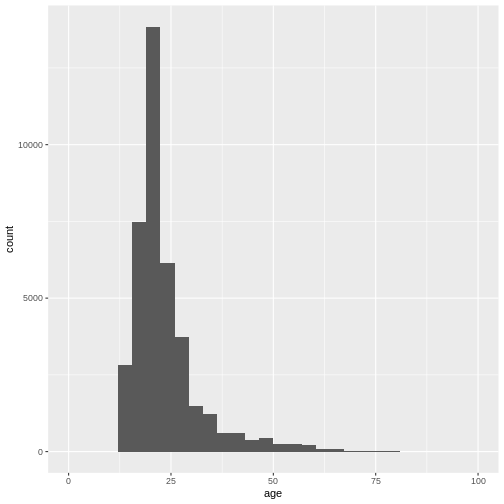
Figure 3
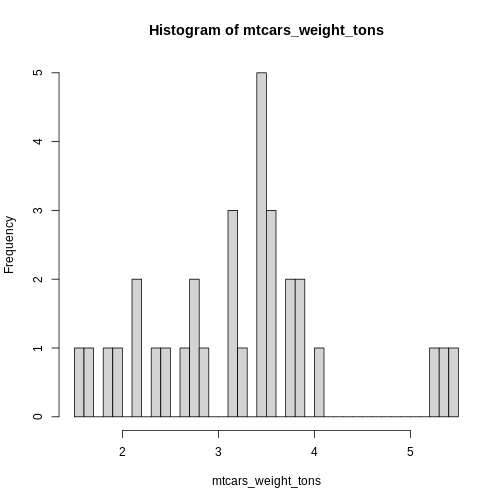
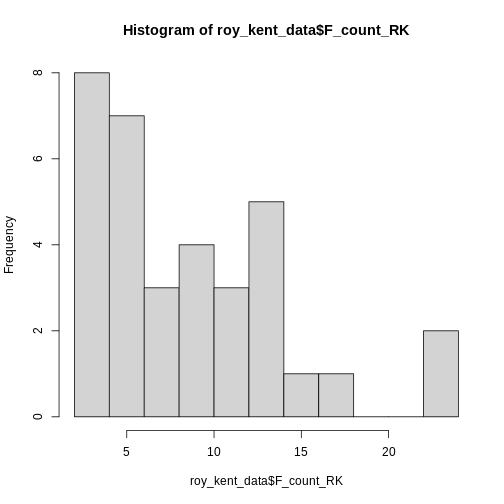
 We can also adjust the size of the bins, not the number of bins by using
the
We can also adjust the size of the bins, not the number of bins by using
the binwidth argument.
Figure 4
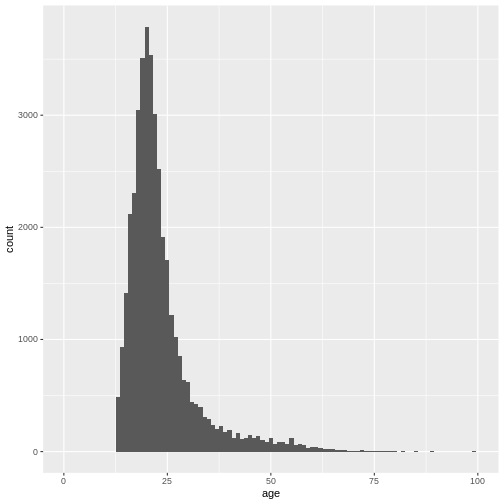
Figure 5
Figure 6

Figure 7
Figure 8
Figure 9
Figure 10
Figure 11
Figure 12
Figure 13
Figure 14
Filtering data
Figure 1
Figure 2
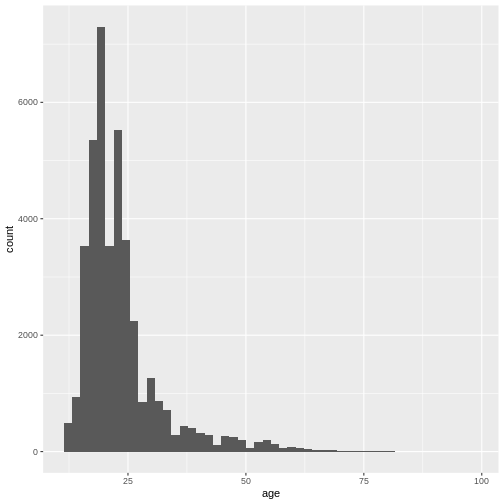
Figure 3

Figure 4
Figure 5
Figure 6

Figure 7

Figure 8

Creating new columns
Count and Summarize
Midterms
Figure 1
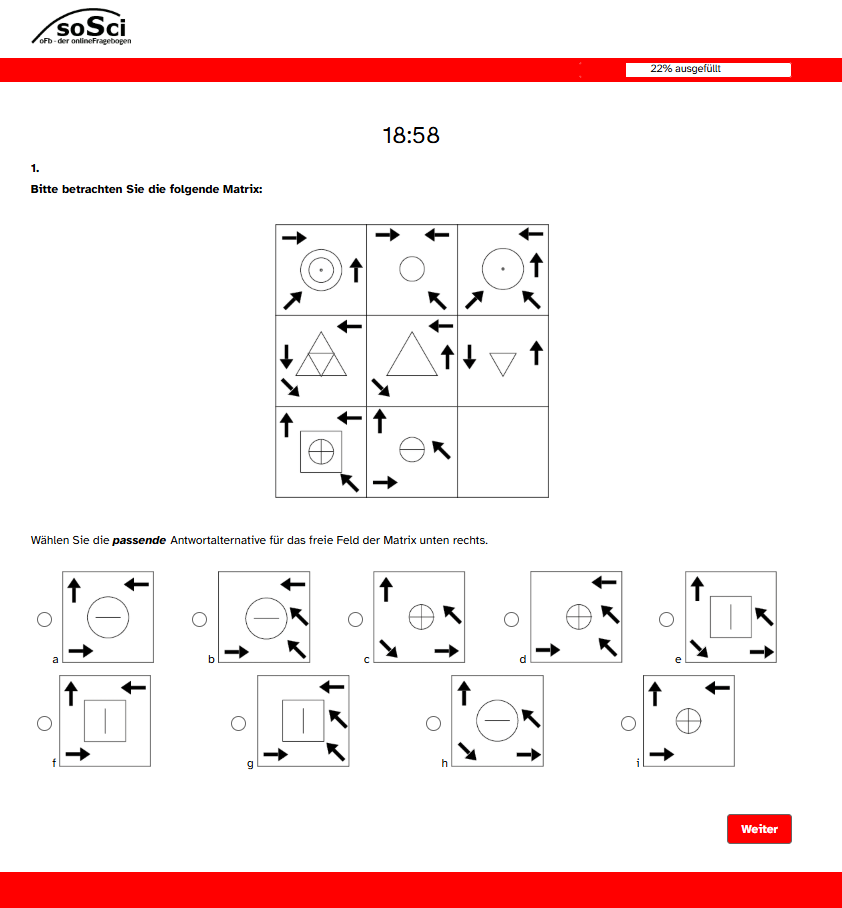
Intelligence Test (HeiQ) Item with red
background
t-Test
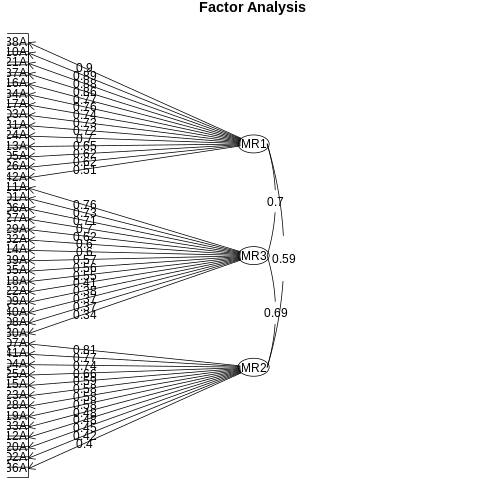
Factor Analysis - Introduction & EFA
Figure 1
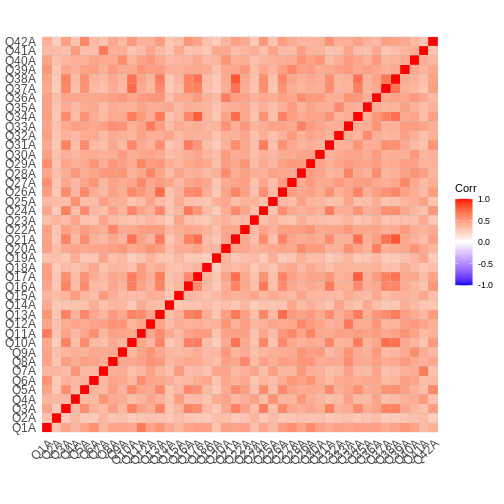
Figure 2
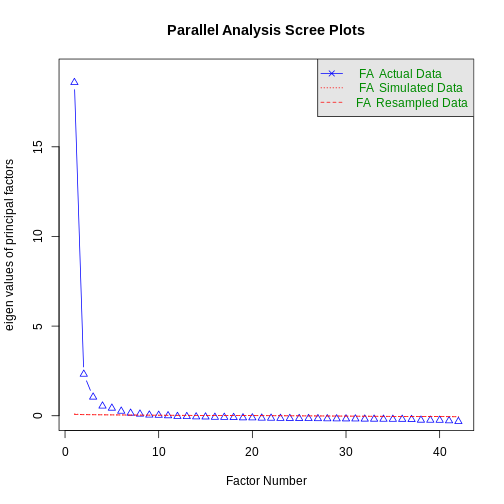
Figure 3